The meetings are organized by Enrico Toffalini in collaboration with the PsicoStat group.
IMPORTANT: Some updated and more recent materials may be available on this GitHub website.
05th of June, 2024
Psychometric Network Analysis (by Anna Panzeri)
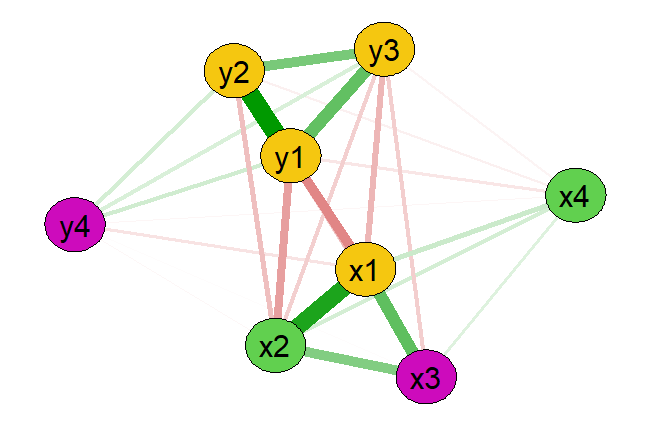
Have you already tried using network analysis? Maybe you used it as an exploratory phase, maybe because it allows us to draw beautiful and colorful graphs, or maybe as a last resort when everything else has failed. But what does network analysis really do? Under what assumptions is it valid? When does it make sense to use it or not? What perspectives can it open from a psychometric point of view? We will try to understand why psychologists need to know about network analysis to decide whether to use it… or maybe not use it!
Click here to see an important article by Eiko Fried on factor vs network analysis
Click here to see another important article, by Neal and colleagues, on a series of critiques of psychometric network analysis (here available open access)
23rd of May, 2024
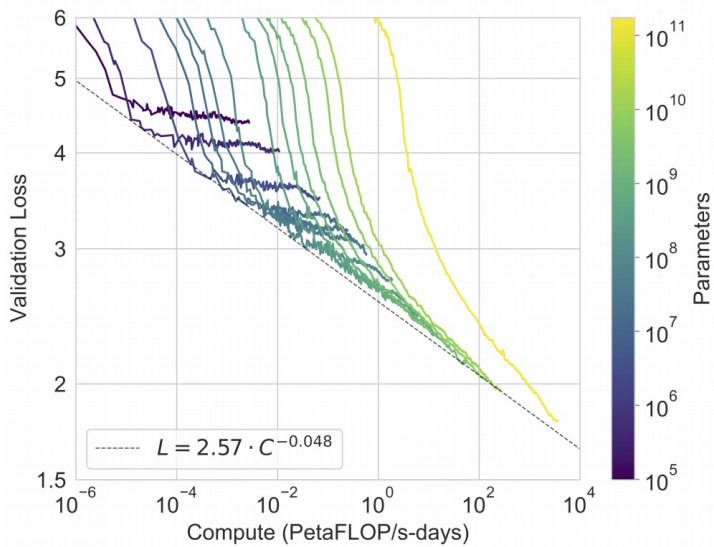
Artificial Intelligence tools for research in psychology and social sciences (by Alberto Testolin)
Click here to see the slides (by Alberto Testolin)
Click here to see an example of text embeddings computed via Hugging Face models
Click here to see an example of use of chatGPT via OPENAI API in R
16th of May, 2024
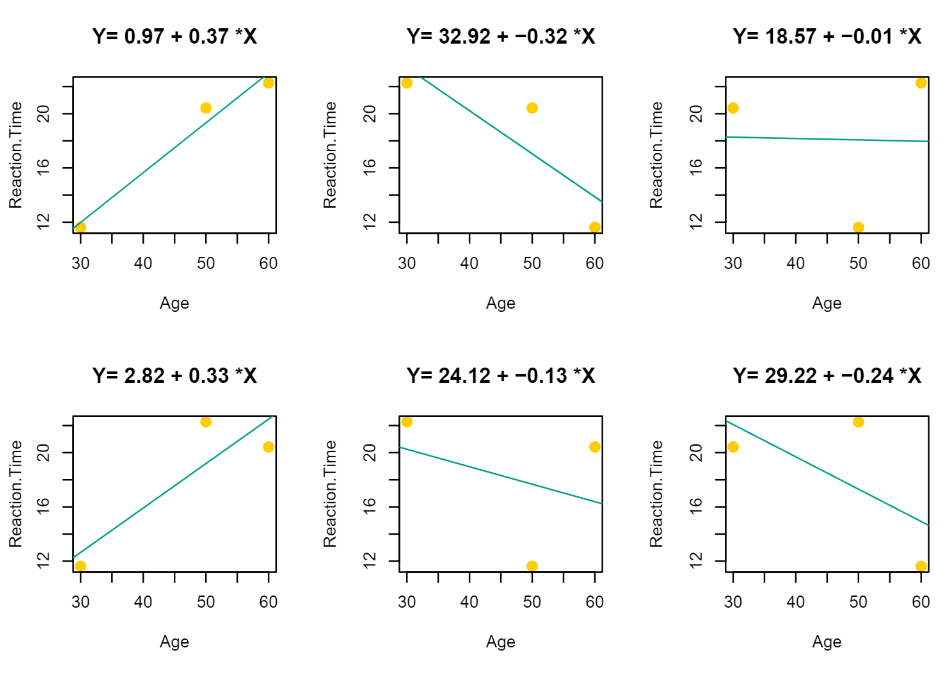
Power analysis for a study on Reaction Times (by Massimiliano Pastore)
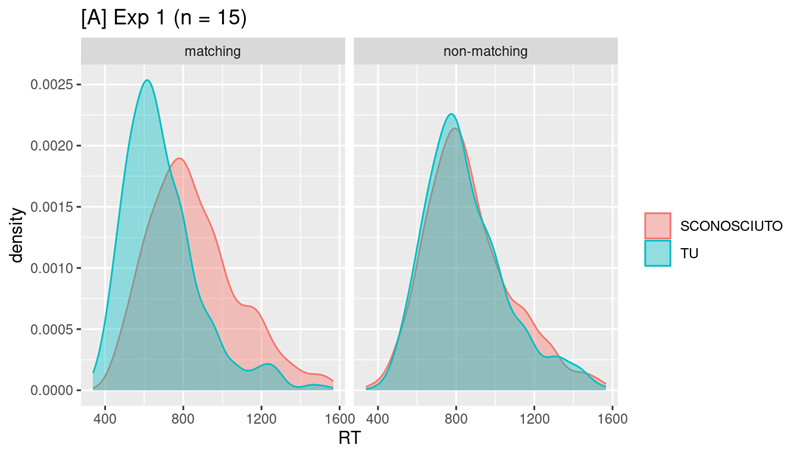
Power analysis via Monte Carlo simulation for a study investigating Reaction Times as the dependent variable
Click here to see the Rmarkdown report
27th of March, 2024
Multilevel Confirmatory Factor Analysis (CFA): An introduction with examples and code
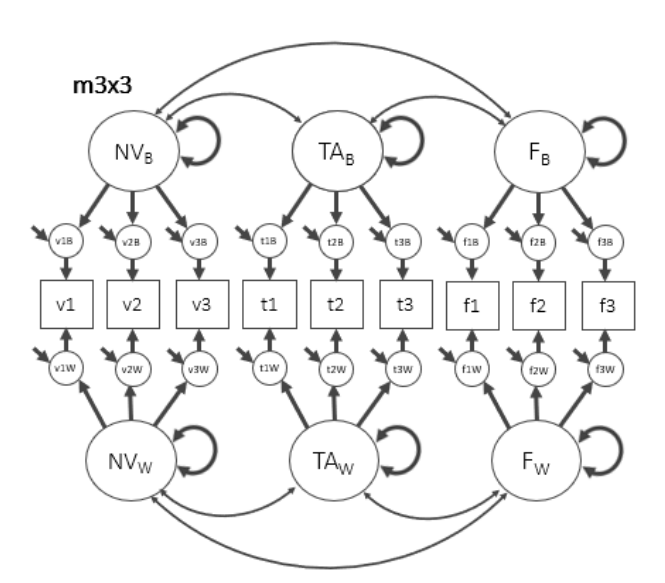
Confirmatory factor models (CFA) are fundamental for the measurement of psychological constructs, and are the basis of SEM. Very often, however, we collect non-independent observations. For example, we could administer the same items to the same subjects on multiple occasions, or groups of participants could belong to clusters such as schools, organizations and other entities. In these cases, as in mixed-models, it is necessary to take into account the “multilevel” structure of the data, which however can be interesting to study as such. In fact, multilevel CFA are fundamental to support the conceptualization of multilevel constructs such as state anxiety vs. trait or individual anxiety vs. group anxiety. This is why we need to know about multilevel CFA!
Click here to see the presentation slides
Click here to download some additional rmd code
21st of February, 2024
Interactions and effect sizes: how to interpret them?
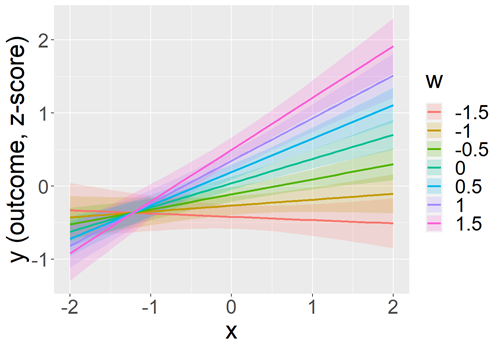
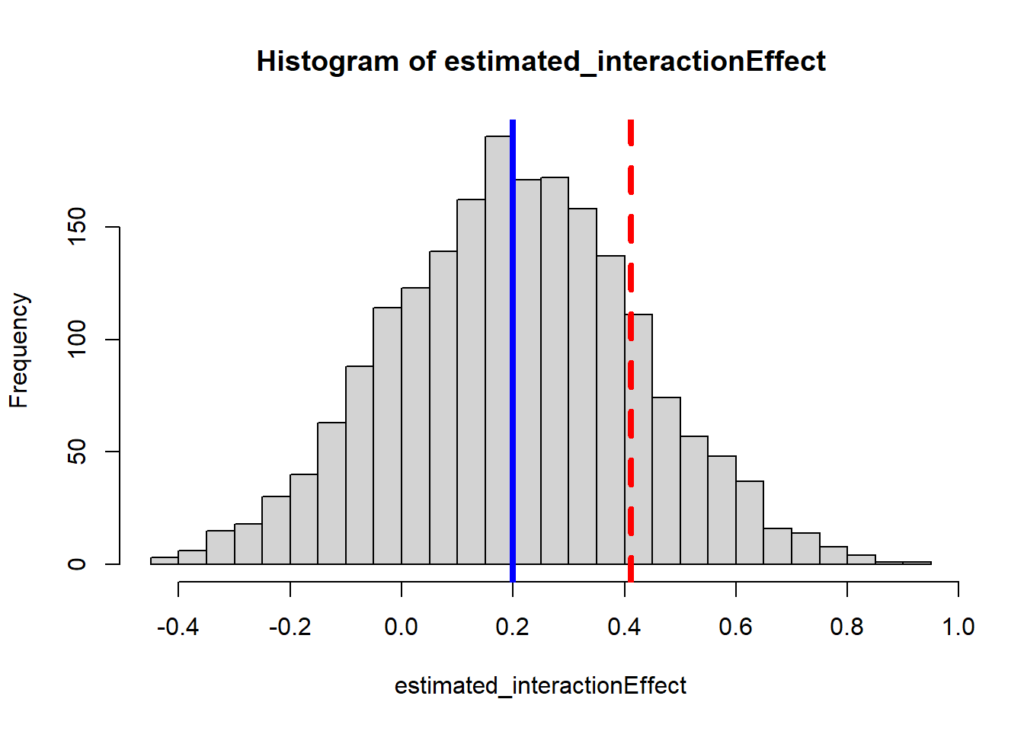
Why is this important? In the last meeting we provided some fundamental insights into interpreting effect sizes for “main effects.” However, a large portion of the research we conduct is not aimed at “discovering” main effects, which are often already well known, but at “discovering” the factors that moderate those effects, namely, to “discover” interactions. But how should effect sizes be interpreted in interactions?
Interaction and effect sizes: click here to see the Rmarkdown
Click here to see an additional example with power simulation.
Fully open code on GitHub here
2nd of February, 2024
Effect Sizes: interpretation and reporting from simple to complex
Cohen’s d and correlation: click here to see the Rmarkdown
Effect size in mixed-model and glm: click here to see the Rmarkdown
Some additional materials: click here
click here to download the full Rmarkdown code and materials
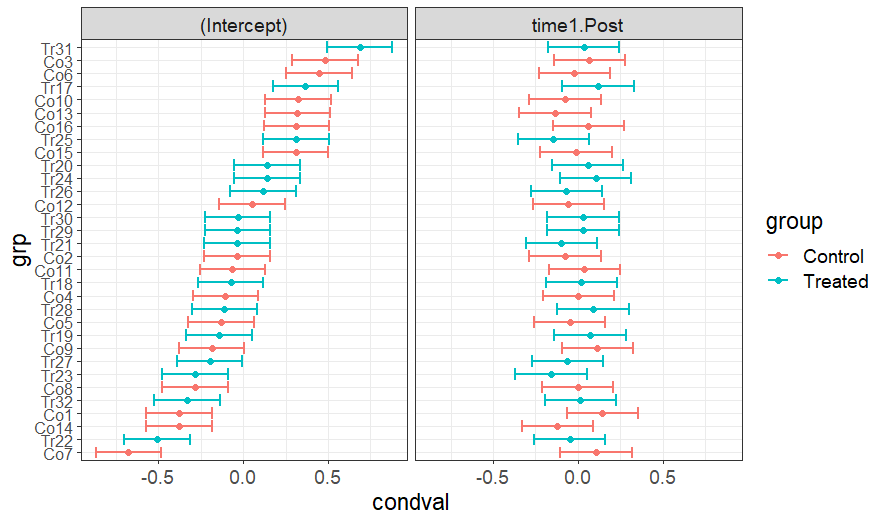
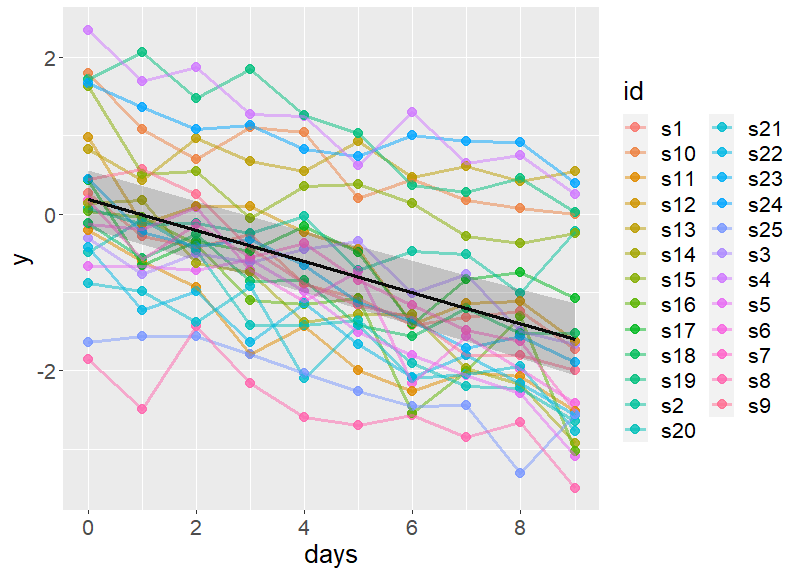
15th of November + 13th of December, 2023
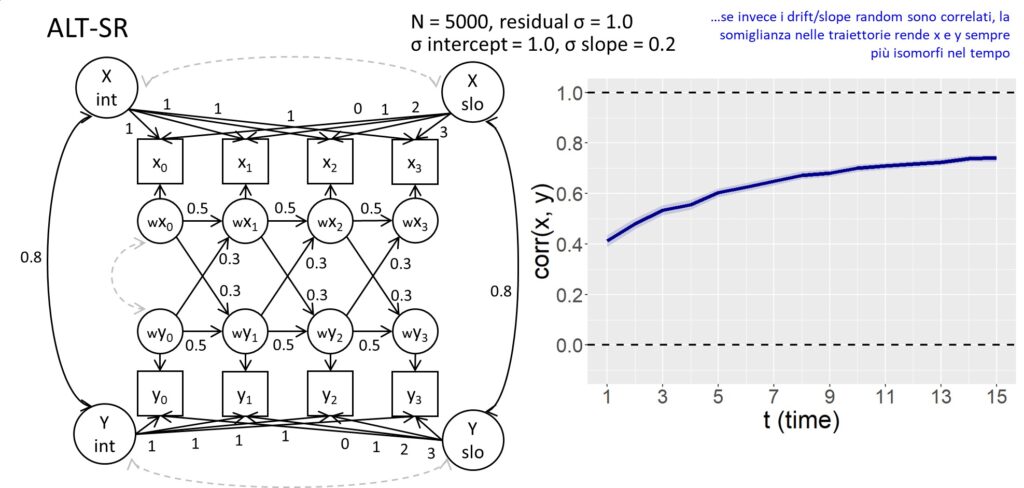
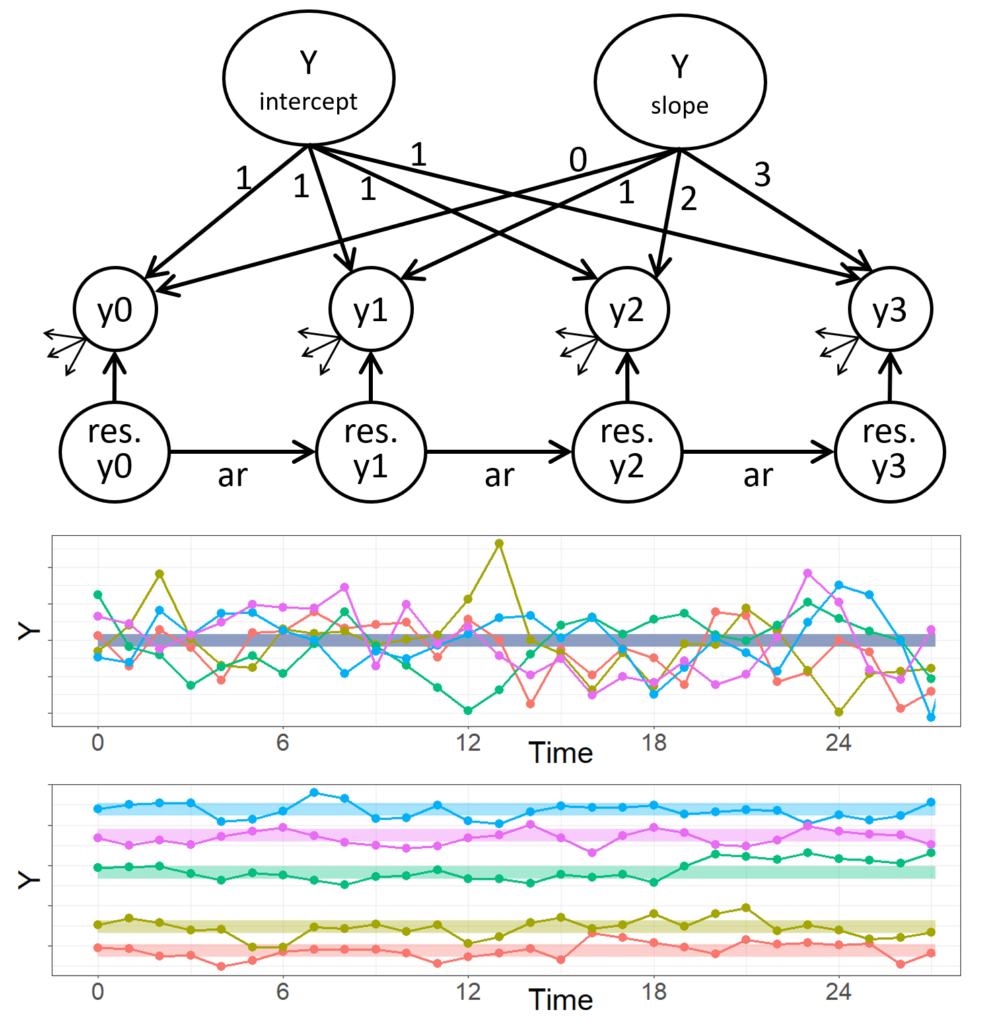
Longitudinal models for panel data: R code, extensions, and examples
Click here to see a preview of the slides
see here a supporting Rmarkdown with simulation and model fitting
dataset for exercise: download (NOT the one in the slides)
(prior meeting slides are here)
30th of November, 2023
Power simulation: a real case
Click here to see the slides
see an supporting markdown here
31st of October, 2023
GLM, overdispersion, and the “flipscores” package
Click here to see the introductory Rmarkdown
19th of October, 2023
Longitudinal models for panel data (with few waves): What research questions can we address?
Click here to see the slides
also, enjoy this shiny app that supports the slides
13th of September, 2023
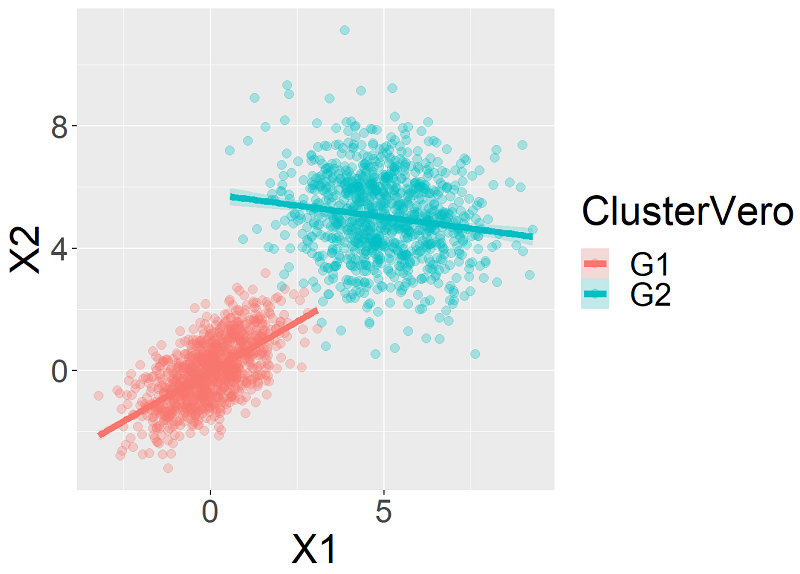
Assessing inferential risks when Clustering, and designing a Shiny App for a tutorial
Click here to see the slides
Click here to download the R code
Click here to see an additional markdown and here for a related article
06th of September, 2023
Power analysis for LMM: a real case of power simulation
Click here to see the slides
Click here to download the R code
28th of June, 2023
Livio Finos: Permutation testing… including repeated measures and covariates
Click here to see the slides
07th of June + 14th of June, 2023
Enrico Toffalini, Massimiliano Pastore: Basic tutorial on “brms”
Click here to see the slides
Click here to download the R code
17th of May, 2023
Enrico Toffalini and Filippo Gambarota: Tutorial on simulating mixed-effects models for designing multi-lab studies (and meta-analyses)
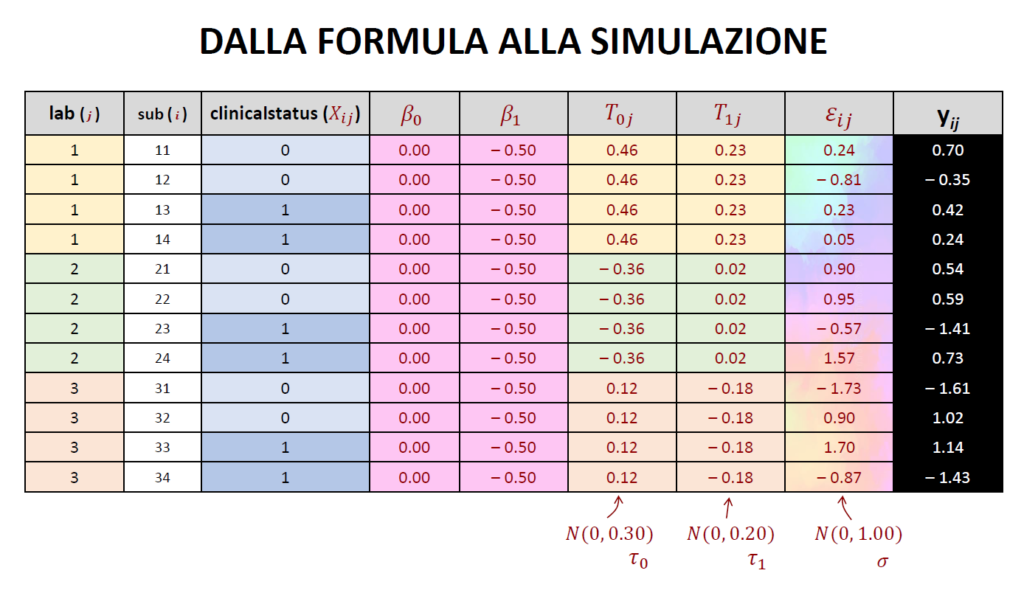
What is similar between a mixed-effects model, a multi-lab study, and a meta-analysis? How can we simulate these scenarios? Here is some slides and code:
Click here to see the slides
Click here to download the R code
19th of April, 2023
Umberto Granziol: Analyses with and without planned comparisons: some practical examples

A very important and applicative topic! Customizing contrasts in our linear models may help make it our hypothesis testing much more straightforward, and helps us interpret the model parameters. Practical examples are presented on simulated data.
Click here to download the datasets and code for the exercises
22nd of March + 5th of April, 2023
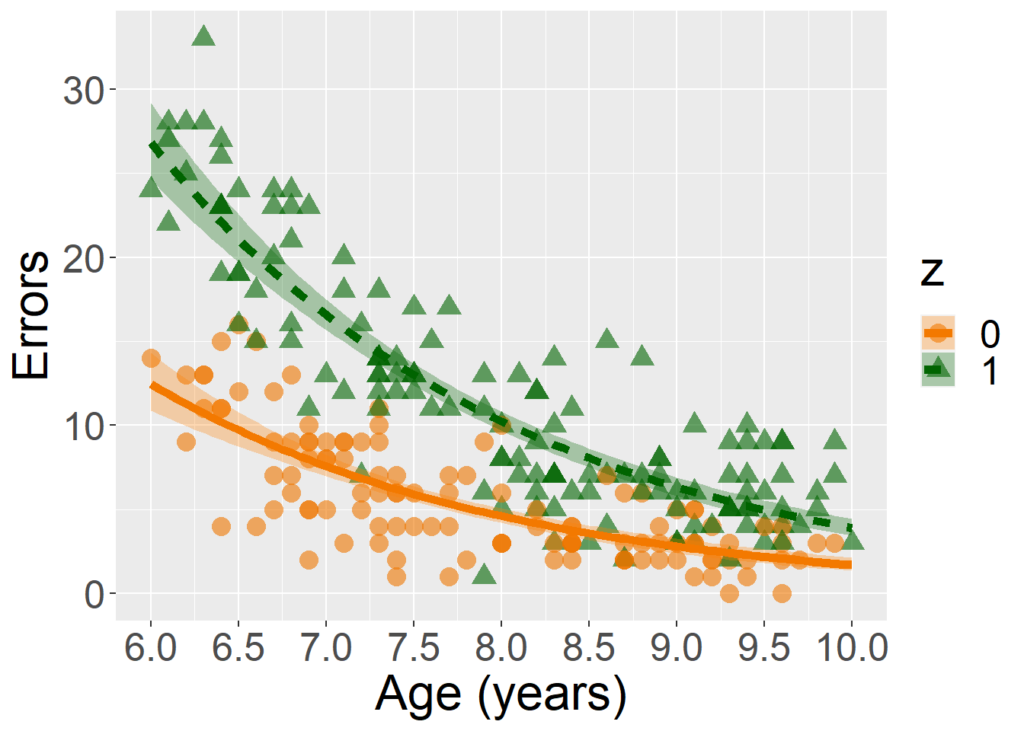
Gianmarco Altoè: Logistic regression (and generalized linear models in Psychology)
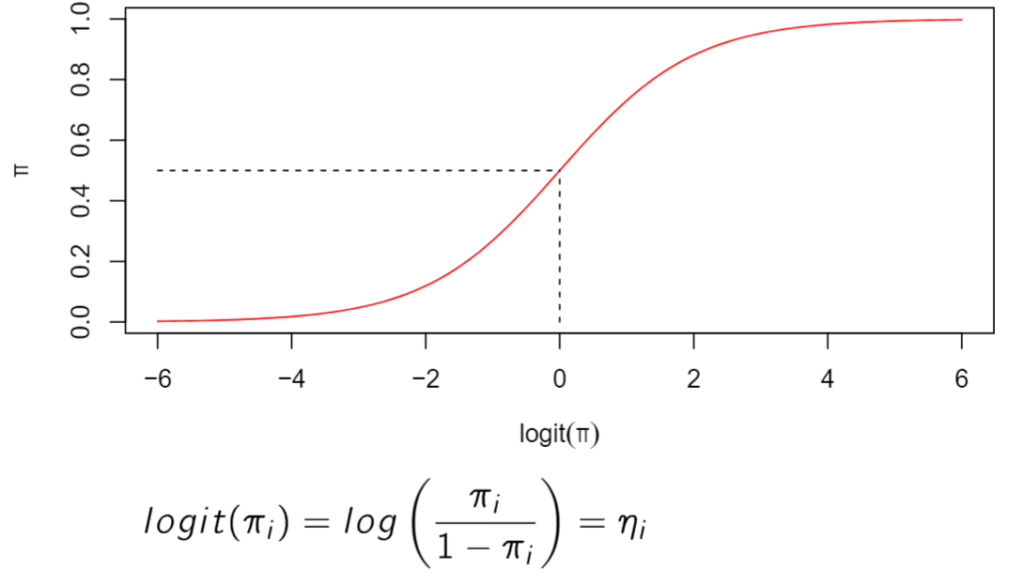
Very often, response variables in psychology are not generated by Normal distributions, which leads to fundamental violations of the assumptions needed for linear models. Luckily, GLMs (generalized linear models) are available for most situations in which responses are known to be non-normal. Among them, logistic regression is especially important as it allows us to model probabilities for binomial 0 / 1 data (e.g., the probability of observing correct responses as a functions of predictors in an experiment).
Click here to see the slides (22/03/2023)
(Also, see this very important series of slides by prof. Altoè on generalized linear mixed-effects models)
In the second meeting (05/04/2023), some researchers have presented their analyses using mixed-effects logistic regressions.
8th of March, 2023
Practical Exercises on Linear Mixed Models
Click here to see the slides (08/03/2023)
Click here to download the datasets for the exercises (08/03/2023)
22nd of February, 2023
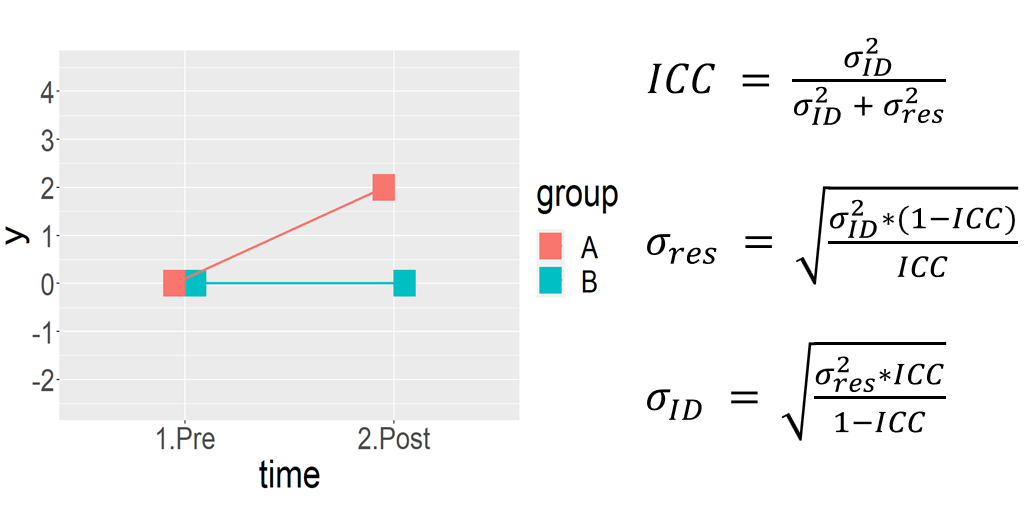
Introduction to Linear Mixed Models
Linear mixed models (LMM) arguably represent the ideal framework for data analysis in most actual research scenarios in psychology. LMM are more flexible and they extract more information from data than common alternatives when they are used to their full potential. When their logic is understood, they are also a powerful aid in the phase of planning new research.
Click here to see the slides (22/02/2023)
Click here to download the R code (22/02/2023)
15th of February, 2023
The “for” loop, and how to run power analysis with simulated data for simple linear models
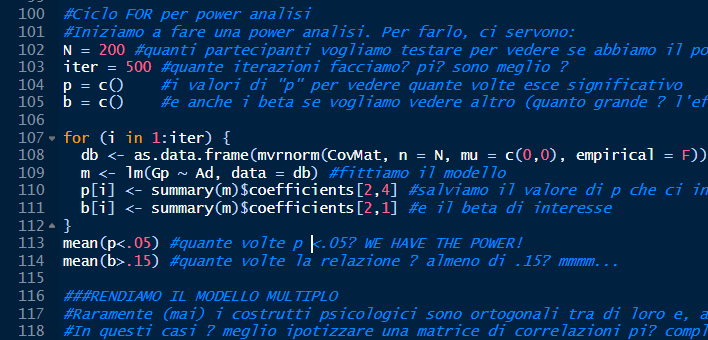
Once the basics facts about coefficients of linear models are understood (see first two meetings), it’s time to run a power analysis. The “for” loop is an intuitive tool for running power analysis using simulated data. In fact, power could be calculated analytically for simple cases, but understanding how to use simulation and the “for” loop opens the way to applying it to more complex scenarios as well. The cases we see here involve basic simple and multiple linear regression models.
Click here to download the slides and R code (15/02/2023)
18th of January + 1st of February, 2023
Coefficients in linear models, interactions, model comparisons, and data simulation
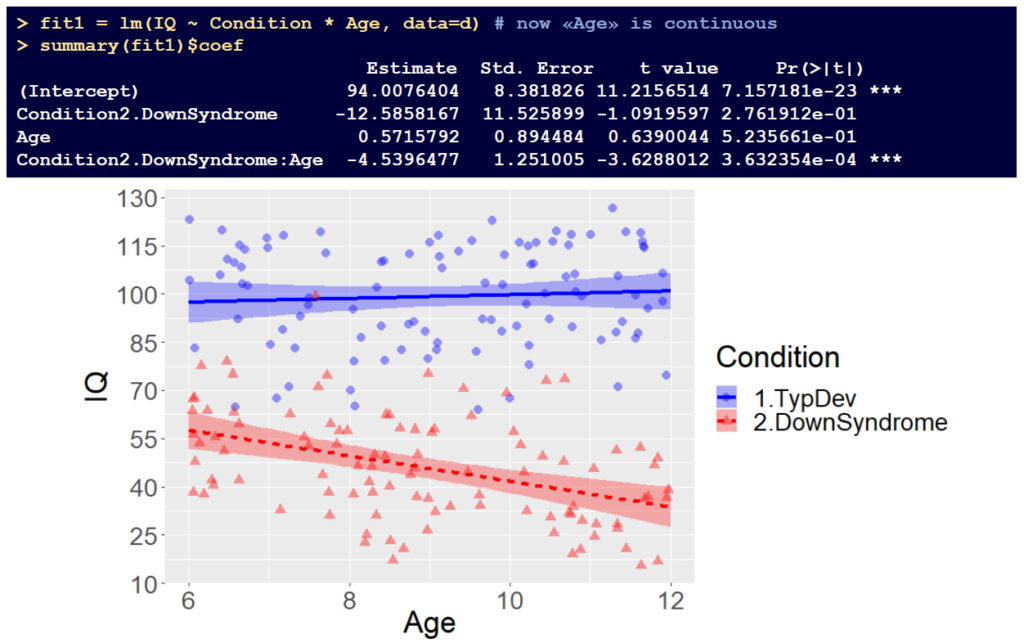
Understanding coefficients in linear models is the starting point for many more complex skills in data analysis. In the first two meetings of this workshop on data analysis, we discussed the interpretation of linear model coefficients in a series of cases featuring models with main effects, with interactions between two category variables and interactions between a continuous and a category variable. Also, we briefly discussed model comparisons and we started practicing some data simulation for the purpose of performing power analysis in the next meeting(s).
Click here to download the slides and R code of the first meeting (18/01/2023)
Click here to download the slides and R code of the second meeting (01/02/2023)